

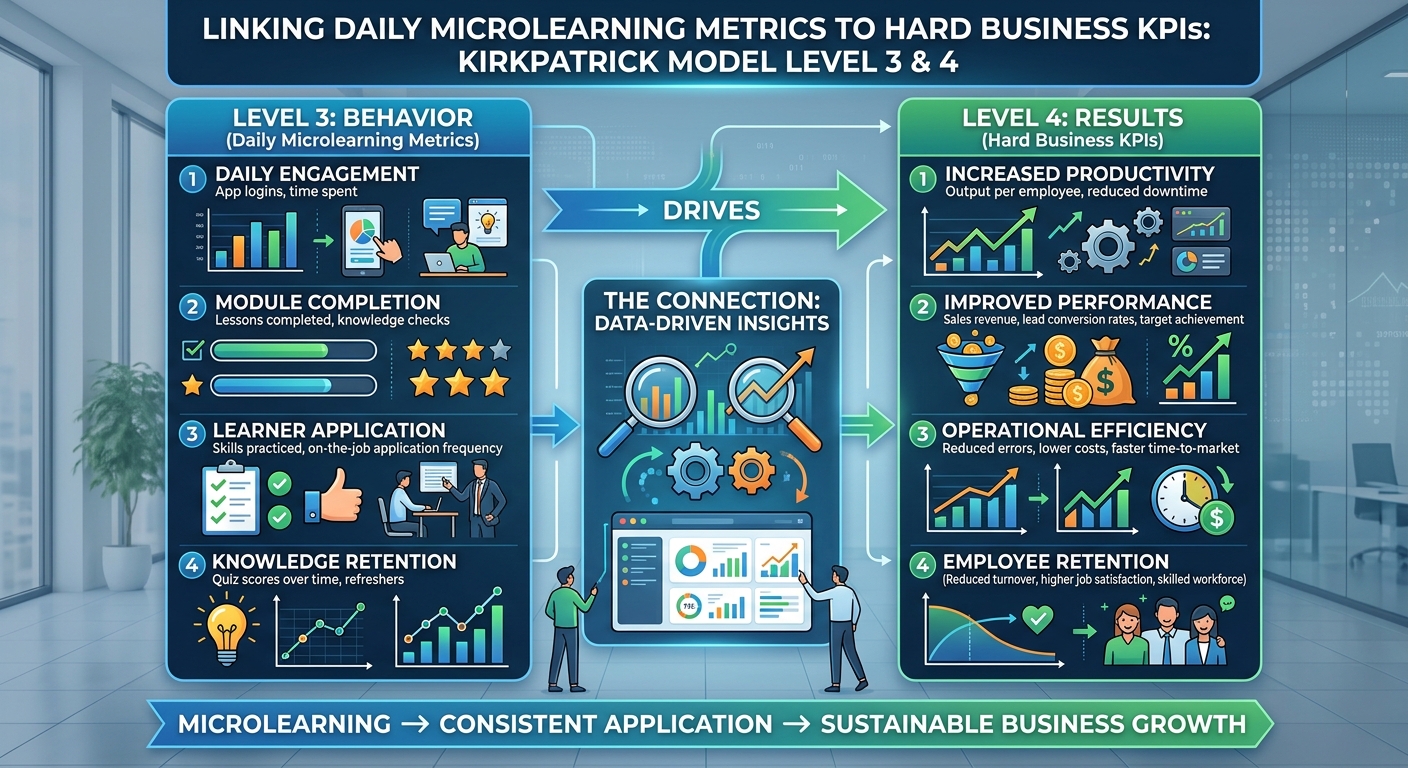
Kirkpatrick Model Level 3 & 4: Linking Daily Microlearning Metrics to Hard Business KPIs
For L&D leaders – from Vice Presidents to Managers – demonstrating a tangible return on investment (ROI) for training initiatives remains one of the most persistent and critical challenges. Traditional training metrics often stop at attendance and satisfaction (Kirkpatrick Levels 1 & 2), leaving a significant gap in proving real business impact. However, with the advent of microlearning and advanced learning management system (LMS) capabilities, bridging the chasm between learning and business outcomes, specifically Kirkpatrick Levels 3 (Behavior) and 4 (Results), is now more achievable than ever before.
This article will delve into how daily microlearning metrics can be effectively linked to hard business Key Performance Indicators (KPIs), empowering L&D professionals across diverse industries like Compliance, Sales, Banking, Finance, Insurance, Retail, Pharma, Healthcare, Hospitality, Oil and Gas, and Mining to showcase the true value of their work.
Understanding Kirkpatrick Levels 3 & 4 in a Modern Context
Level 3: Behavior – The Application of Learning
Level 3 measures the extent to which participants apply what they learned during training when they return to their jobs. Historically, this involved observations, interviews, or self-assessments – methods that were often time-consuming, subjective, and difficult to scale. The core question here is: Are employees actually doing things differently as a result of the training?
Level 4: Results – The Impact on Business Outcomes
Level 4 is the ultimate goal: measuring the bottom-line impact of training on organizational goals. This includes metrics like increased sales, reduced costs, improved quality, enhanced customer satisfaction, fewer safety incidents, or higher employee retention. This level directly answers the C-suite's perennial question: How does this training contribute to our strategic objectives?
The challenge has always been establishing a clear, quantifiable link between Level 3 behavior changes and Level 4 business results, especially across large, distributed workforces.
The Microlearning Advantage: Granular Data for Deeper Insights
Microlearning, characterized by bite-sized, focused content delivered just-in-time, inherently generates a wealth of granular data. Unlike lengthy courses, each micro-module, quiz, or simulation provides distinct data points on engagement, comprehension, and application intent. This is where a robust Microlearning LMS becomes invaluable.
This type of learning management software or learning management solutions allows for tracking not just completion rates, but also:
- Module mastery scores
- Time spent on specific topics
- Engagement with interactive elements (e.g., Gamified LMS features)
- Participation in peer discussions or application scenarios
- Frequency of revisiting critical compliance or sales process modules
This detailed data stream acts as the perfect bridge for connecting to behavioral changes.
Linking Microlearning Metrics to Level 3 (Behavior)
To demonstrate behavior change, L&D leaders need to correlate microlearning engagement and performance data with observable actions on the job.
- Compliance Training: In industries like Banking, Finance, Healthcare, and Oil & Gas, specific micro-modules on new regulations or safety protocols can be tracked. High scores on risk-assessment micro-quizzes, combined with frequent review of critical policy modules, can indicate a heightened awareness and readiness to apply compliant behaviors. An enterprise learning management system can monitor repeat visits to modules on specific compliance areas, suggesting proactive learning.
- Sales Training: For Sales teams, microlearning focused on objection handling, product features, or CRM usage can be linked to sales call observations or recorded interactions. For instance, improved scores on micro-simulations about a new product might correlate with sales reps more confidently discussing those features in live calls, as captured by a Learning content management system (LCMS) that also tracks content usage.
- Customer Service (Retail, Hospitality): Micro-modules on handling difficult customers or upselling techniques can be followed up with short, manager-led observations or peer reviews. Data from the lms learning management system showing mastery of these modules becomes the precursor to observed behavioral improvements.
Bridging to Level 4 (Results): The Ultimate ROI
This is where the magic happens – connecting observed behaviors (Level 3) to hard business KPIs (Level 4). This requires integrating data from your cloud based learning management system with operational and business intelligence platforms.
Consider the following industry-specific examples:
- Compliance (Banking, Finance, Pharma):
- Level 3 Link: Consistent high scores on Risk-focused Training micro-modules related to data privacy.
- Level 4 KPI: Reduction in data breach incidents, lower regulatory fines, improved audit scores.
- Sales (All Industries):
- Level 3 Link: Engagement with AI Powered Authoring Tool-generated micro-content on new sales methodologies, leading to higher proficiency scores.
- Level 4 KPI: Increased conversion rates, reduced sales cycle length, higher average deal size, improved quota attainment.
- Healthcare (Pharma, Hospitals):
- Level 3 Link: Mastery of micro-modules on new patient safety protocols or medication administration procedures.
- Level 4 KPI: Decrease in medical errors, reduction in hospital-acquired infections, improved patient satisfaction scores.
- Operations (Retail, Oil & Gas, Mining):
- Level 3 Link: High completion and comprehension of microlearning on equipment maintenance or safety procedures.
- Level 4 KPI: Reduced equipment downtime, fewer safety incidents, increased operational efficiency, lower insurance premiums.
Leveraging Advanced Capabilities for Deeper Insights
The sophistication of modern learning platforms and data analytics allows for previously impossible connections:
How can intelligent systems help L&D leaders predict future performance improvements based on current training data?
Advanced analytics, often powered by machine learning, within your LMS can identify patterns between microlearning engagement (e.g., completion of specific Adaptive Learning paths) and subsequent performance changes. By analyzing historical data, the system can flag learners who might be at risk of underperforming based on their training metrics and suggest proactive interventions. This predictive capability transforms L&D from reactive to strategic, allowing for targeted development before performance issues arise.
What role do smart tools play in optimizing content delivery for specific regional or departmental needs?
Smart tools, particularly those integrated into a comprehensive learning management system, can analyze learner demographics, regional performance data, and even local regulatory requirements. This enables automatic tailoring of microlearning content, ensuring that employees in different locations or departments receive the most relevant and impactful training. For instance, a global bank could use this to deliver country-specific compliance micro-modules, ensuring local relevance and maximizing behavioral impact.
Beyond basic reporting, how can data analysis provide actionable insights into the effectiveness of learning interventions?
Beyond simple dashboards, sophisticated data analysis can reveal causal links between specific microlearning interventions and business outcomes. For example, it can highlight that a particular sequence of LCMS modules on customer empathy directly correlates with a quantifiable increase in customer satisfaction scores within a specific division. These actionable insights empower L&D to continuously refine content, delivery methods, and even identify new areas for Risk-focused Training, maximizing the impact of every learning dollar spent.
Practical Steps for L&D Leaders
To effectively link microlearning to business KPIs, L&D leaders should:
- Define Clear KPIs Upfront: Before designing any microlearning, identify the specific Level 3 behaviors and Level 4 business results you aim to influence.
- Integrate Your Learning Platform: Ensure your MaxLearn LMS or any lms learning management system can seamlessly integrate with HRIS, CRM, ERP, and other business intelligence systems. This data synergy is crucial.
- Utilize Advanced Analytics: Leverage the analytical capabilities of your learning content management system to identify correlations and causation.
- Communicate and Iterate: Share your findings with stakeholders and continuously refine your microlearning strategies based on the data.
Conclusion
The era of L&D operating as a cost center, unable to definitively prove its value, is drawing to a close. By strategically implementing microlearning and leveraging the powerful analytics offered by modern learning management solutions, L&D leaders can now directly link daily training activities to significant business outcomes. This shift not only elevates the L&D function to a strategic business partner but also ensures that every learning intervention is purposeful, impactful, and demonstrably contributes to the organization's bottom line. The future of L&D is data-driven, and microlearning is the key to unlocking its full potential across all industries.
.jpg)


