

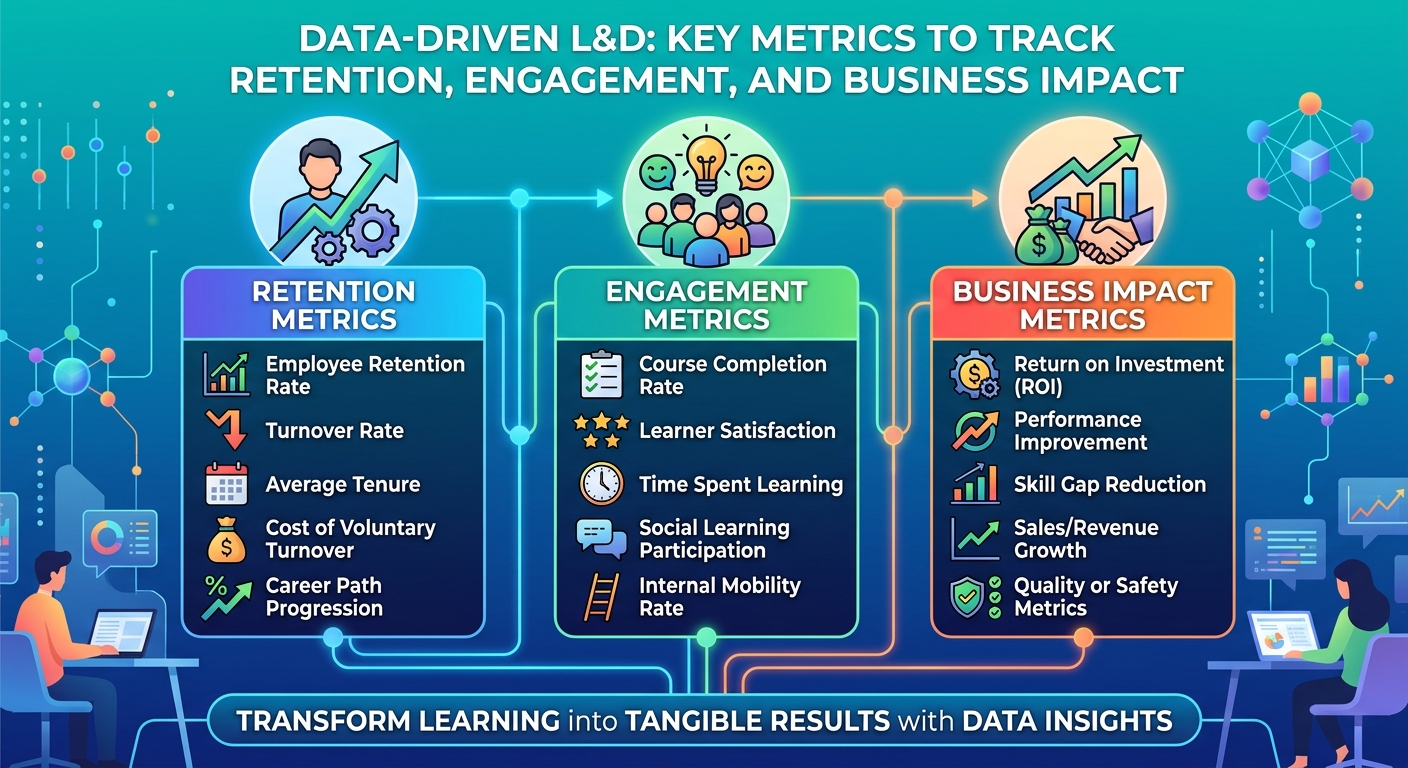
Data-Driven L&D: Key Metrics to Track Retention, Engagement, and Business Impact
In today's dynamic corporate landscape, Learning & Development (L&D) is no longer a peripheral function but a strategic imperative. For Vice Presidents, Directors, and Senior Managers of L&D, the demand to demonstrate tangible value has never been higher. Moving beyond anecdotal success stories, the shift towards a data-driven approach is essential for proving the efficacy of training programs, optimizing resources, and ultimately, contributing to core business objectives. This article explores the critical metrics L&D leaders must track to effectively measure employee retention, engagement, and overall business impact across diverse industries from Compliance and Sales to Banking, Finance, Insurance, Retail, Pharma, Healthcare, Hospitality, Oil and Gas, and Mining.
The Imperative of Data-Driven L&D
Moving Beyond Intuition to Strategic L&D
For too long, L&D decisions have often been based on intuition, past practices, or simply what felt right. While experience is invaluable, it lacks the verifiable evidence needed to secure budgets, justify initiatives, and align with C-suite expectations. A data-driven L&D strategy transforms learning from a cost center into a quantifiable value driver. It provides the insights necessary to understand what’s working, what isn’t, and where investments should be prioritized. Embracing a robust LMS or a sophisticated learning content management system is the first step towards collecting this invaluable data.
Key Metrics for Retention
Employee retention is a cornerstone of organizational stability and success. High turnover not only incurs significant recruitment and training costs but also leads to loss of institutional knowledge and disruption. L&D plays a crucial role in fostering an environment where employees feel valued, competent, and see a clear path for growth, thereby improving retention.
Tracking Employee Lifecycles and Career Progression
- Turnover Rate Post-Training: Track the percentage of employees who leave the organization within a specific period (e.g., 6-12 months) after completing critical training programs. A lower rate suggests effective training contributes to job satisfaction and loyalty.
- Internal Promotion Rate: The percentage of positions filled by internal candidates. This metric indicates the effectiveness of L&D in developing talent for advancement, signaling career growth opportunities within the company.
- Succession Planning Readiness: Measure the number or percentage of employees identified as ready for promotion into key roles, directly reflecting L&D's ability to build a robust talent pipeline.
- Time to Productivity: For new hires, track the time it takes to reach full productivity after onboarding and initial training. Shorter times demonstrate efficient and effective learning programs.
- Retention of High-Potentials: Specifically monitor the retention rates of your top-performing and high-potential employees. Tailored development programs via Adaptive Learning can significantly impact this.
Question for Insight: How can predictive analytics systems leverage learning data to identify employees at risk of leaving, allowing for targeted intervention strategies?
Key Metrics for Engagement
Engaged employees are more productive, innovative, and committed. L&D programs are a significant driver of engagement, offering opportunities for skill development, knowledge acquisition, and personal growth. Measuring engagement helps L&D optimize learning experiences and ensure relevance.
Measuring Learner Interaction and Program Impact
- Course Completion Rates: The percentage of learners who complete assigned courses. High completion rates indicate compelling content and effective delivery, potentially supported by a Microlearning LMS.
- Learner Satisfaction (NPS/Surveys): Gauge how learners feel about the training content, delivery, and relevance. A high Net Promoter Score (NPS) or positive survey feedback suggests high engagement and perceived value.
- Time Spent Learning: Track the average time employees spend engaging with learning content. This can indicate interest and the depth of engagement, especially when utilizing a learning management software that offers detailed analytics.
- Participation Rates: Measure active participation in live sessions, discussion forums, workshops, or practical exercises. This is particularly relevant for interactive or Gamified LMS environments.
- Application of Learning: Assess how frequently learners apply new skills or knowledge in their day-to-day roles. This can be measured through manager observations, self-assessments, or performance reviews.
- Content Utilization: Beyond assigned courses, track voluntary access to additional learning resources, indicating proactive engagement and a culture of continuous learning facilitated by a comprehensive learning management system.
Question for Insight: What sophisticated tools can personalize learning paths and content recommendations based on an individual's progress, role, and expressed interests to maximize engagement across diverse teams globally?
Key Metrics for Business Impact
Ultimately, L&D must demonstrate its contribution to the bottom line. This requires linking learning outcomes directly to organizational performance metrics, proving that training investments yield measurable returns.
Connecting Learning to ROI and Strategic Objectives
- Performance Improvement: Measure improvements in key performance indicators (KPIs) directly related to the training. For example, a sales training program should lead to increased sales figures, or a compliance training program to reduced incidents.
- Sales Uplift/Revenue Growth: For sales teams, track increases in conversion rates, average deal size, or overall revenue following sales-specific training delivered via an AI Powered Authoring Tool.
- Compliance Adherence & Risk Reduction: In industries like Banking, Pharma, or Oil and Gas, track the reduction in compliance breaches, safety incidents, or regulatory fines after Risk-focused Training. This directly impacts operational costs and reputation.
- Customer Satisfaction Scores (CSAT/NPS): For customer-facing roles (e.g., Retail, Hospitality), measure improvements in customer satisfaction or Net Promoter Scores after customer service training.
- Efficiency Gains/Cost Reduction: Quantify how training leads to more efficient processes, reduced errors, or lower operational costs. This could be in manufacturing, logistics, or administrative functions.
- Innovation & Idea Generation: In fields requiring creativity, track the number of new ideas, patents, or process improvements generated by trained employees.
- Employee Productivity: Measure the output or efficiency of employees before and after training, using metrics relevant to their roles.
Question for Insight: How do enterprise learning management platforms help global organizations track and adapt learning effectiveness across different regions and regulatory environments, ensuring consistent business impact?
Leveraging Technology for Data-Driven L&D
Implementing a data-driven L&D strategy relies heavily on the right technology. A modern learning management system (LMS) is not just a content repository; it's a powerful analytics engine.
The Role of a Robust LMS and Analytics Platforms
A sophisticated LMS provides the infrastructure to collect, analyze, and report on the metrics discussed above. Features to look for in a suitable learning management solutions include robust reporting dashboards, integration capabilities with HRIS and performance management systems, and advanced analytics. A cloud based learning management system offers scalability and accessibility, making it easier to deploy learning globally and gather consistent data.
For L&D leaders, the challenge isn't just collecting data, but interpreting it. This is where advanced analytics come into play. Many modern enterprise learning management systems, like MaxLearn LMS, offer AI-driven insights that can identify trends, predict outcomes, and recommend interventions. This transforms raw data into actionable intelligence. Utilizing an Adaptive Learning approach, driven by data, ensures that learning pathways are continually optimized for individual and organizational needs.
Moreover, authoring tools with integrated intelligence can streamline content creation and ensure relevance. An AI Powered Authoring Tool, for example, can suggest content improvements, identify knowledge gaps, and even automate parts of the content development process, freeing up L&D teams to focus on strategy and analysis. Combining this with a Microlearning LMS allows for rapid deployment and continuous iteration of learning content, keeping it fresh and impactful.
An integrated LCMS (Learning Content Management System) within a comprehensive learning management software suite allows for not only data tracking but also efficient management and deployment of learning resources, ensuring a seamless experience from content creation to consumption and impact analysis.
Conclusion
For L&D Vice Presidents, Directors, and Managers, the era of data-driven decision-making is here to stay. By meticulously tracking key metrics related to retention, engagement, and business impact, L&D can transform from a supportive function into a strategic partner, directly contributing to organizational success. Embracing the right technology – a powerful learning management system with advanced analytics capabilities – is paramount to this transformation. It's about demonstrating undeniable value, optimizing learning investments, and building a workforce that is not only skilled and engaged but also loyal and highly productive. Start leveraging your data today to shape the future of learning in your organization.


